---
myst:
html_meta:
description: Deploy Logging, Monitoring, and Alerting (LMA) stack with Telegraf, Prometheus, Grafana, and Alertmanager for infrastructure observability.
---
(set-up-your-lma-stack)=
# Set up your LMA stack
```{note}
**LMA to COS**
The LMA stack is being succeeded by the Canonical Observability Stack (COS). While the current LMA still works, most users are recommended to consider COS instead. For more information, refer to [this COS topic](https://charmhub.io/topics/canonical-observability-stack/). In environments with more limited resources, there is also [COS lite](https://charmhub.io/topics/canonical-observability-stack/editions/lite).
```
Logging, Monitoring, and Alerting (LMA) is a collection of tools that guarantee the availability of your running infrastructure. Your LMA stack will help point out issues in load, networking, and other resources before they become a failure point.
## Architectural overview
Canonical's LMA stack involves several discrete software services acting in concert.
[**Telegraf**](https://docs.influxdata.com/telegraf/v1/) collects metrics from the operating system, running software, and other inputs. Its plugin system permits export of data in any arbitrary format; for this system we collect the data in a central data manager called [**Prometheus**](https://prometheus.io/docs/introduction/overview/).
Prometheus works as a hub, polling data from different Telegraf nodes and sending it to various outputs, including persistent storage. For this LMA stack, visualization is handled via [**Grafana**](https://grafana.com/docs/) and email/pager alerts are generated via the Prometheus {term}`Alertmanager` plugin. See [**Prometheus Alertmanager**](https://prometheus.io/docs/alerting/latest/alertmanager/) for more details.
## Getting started
Let's set up a basic demonstration with two **nodes**, the first acting as a placeholder load with Telegraf installed - the "Workload", and the second acting as our data visualization system - the "Monitor". This will help us familiarize ourselves with the various components and how they inter-operate.
```{note}
For clarity, we'll refer to these two hosts as named: `workload` and `monitor`. If you use other {term}`hostnames `, substitute your preferred names as we go through this guide.
```
The Workload node will be running Telegraf to collect metrics from whatever load we're monitoring. For demonstration purposes we'll just read the CPU/memory data from the node. In a real environment, we'd have multiple hosts (each with their own Telegraf instance) collecting hardware, network, and software statuses particular to that node.
Our Monitor node will double as both a data store and a web UI, receiving data from the Workload, storing it to disk, and displaying it for analysis.
### Ports
As reference, here are the ports we'll be binding for each service:
|||
|---|---|
| Prometheus | `monitor:9090` |
| Alertmanager | `monitor:9093` |
| Grafana | `monitor:3000` |
| Telegraf | `workload:9273` |
### Set up the Workload node
First, let's set up the Workload. We'll be using LXD as our container technology in this guide, but any VM, container, or bare metal host should work, so long as it's running Ubuntu 20.10. With LXD installed on our host we can use its `lxc` command line tool to create our containers:
```bash
$ lxc launch ubuntu:20.10 workload
Creating workload
Starting workload
$ lxc exec workload -- bash
workload:~#
```
On the Workload, install Telegraf:
```bash
workload:~# apt update
workload:~# apt install telegraf
```
Telegraf processes input data to transform, filter, and decorate it, and then performs selected aggregation functions on it such as tallies, averages, etc. The results are published for collection by external services; in our case Prometheus will be collecting the CPU/memory data from the Monitor node.
Open `/etc/telegraf/telegraf.conf` and scroll down to the "INPUT PLUGINS" section. What we'll need is the following configuration settings, which you should find already enabled by default:
```text
[[inputs.cpu]]
percpu = true
totalcpu = true
collect_cpu_time = false
report_active = false
```
Looking at the config file you'll notice it's almost entirely commented out. There are three different types of sections in the file: `[[inputs]]`, which we set above; `[[outputs]]`, which we'll set up next; and the `[[agent]]` setting, with several performance tuning parameters such as the collection interval, which we're setting to 10 seconds. The agent defaults are fine for our example and for basic use.
Finally, we need to define where Telegraf will provide its output. Open `/etc/telegraf/telegraf.conf` and scroll down to the "OUTPUT PLUGINS" section and add the following output configuration:
```text
[[outputs.prometheus_client]]
listen = "workload:9273"
metric_version = 2
#[[outputs.influxdb]]
```
We won't be using `Influxdb`, so you can comment that section out (if it's enabled).
Now restart the Telegraf service:
```bash
workload:~# systemctl restart telegraf
workload:~# systemctl status telegraf
● telegraf.service - The plugin-driven server agent for reporting metrics into InfluxDB
Loaded: loaded (/lib/systemd/system/telegraf.service; enabled; vendor preset: enabled)
Active: active (running) since Sat 2020-10-31 02:17:57 UTC; 6s ago
Docs: https://github.com/influxdata/telegraf
Main PID: 2562 (telegraf)
Tasks: 17 (limit: 77021)
Memory: 42.2M
CGroup: /system.slice/telegraf.service
└─2562 /usr/bin/telegraf -config /etc/telegraf/telegraf.conf -config-directory /etc/telegraf/telegraf.d
...I! Loaded inputs: swap system cpu disk diskio kernel mem processes
...I! Loaded outputs: http prometheus_client
...I! [agent] Config: Interval:10s, Quiet:false, Hostname:"workload", Flush Interval:10s
...I! [outputs.prometheus_client] Listening on http://127.0.0.1:9273/metrics
```
Verify that it is collecting metrics by connecting to Telegraf's web interface:
```bash
workload:~# wget -O- http://workload:9273/metrics
# HELP cpu_usage_guest Telegraf collected metric
# TYPE cpu_usage_guest gauge
cpu_usage_guest{cpu="cpu-total",host="workload"} 0
cpu_usage_guest{cpu="cpu0",host="workload"} 0
cpu_usage_guest{cpu="cpu1",host="workload"} 0
cpu_usage_guest{cpu="cpu10",host="workload"} 0
...
cpu_usage_idle{cpu="cpu-total",host="workload"} 92.74914376428686
cpu_usage_idle{cpu="cpu0",host="workload"} 86.72897196325539
cpu_usage_idle{cpu="cpu1",host="workload"} 90.11857707405758
cpu_usage_idle{cpu="cpu10",host="workload"} 95.95141700494543
```
### Set up the Monitor node
Now let's create the Monitor. As before, we'll be using LXD as the container technology but feel free to adapt these steps to your chosen alternative:
```bash
$ lxc launch ubuntu:20.10 monitor
Creating monitor
Starting monitor
$ lxc exec monitor -- bash
monitor:~#
```
Make a note of the newly created container's IP address, which we'll need later on;
```bash
monitor:~# ip addr | grep 'inet .* global'
inet 10.69.244.104/24 brd 10.69.244.255 scope global dynamic eth0
```
Verify the Workload's Telegraf instance can be reached from the Monitor:
```bash
monitor:~# wget -O- http://workload:9273/metrics
```
We'll be setting up a few components to run on this node using their respective Snap packages. LXD images should normally have snap pre-installed, but if not, install it manually:
```bash
monitor:~# apt install snapd
```
### Install Prometheus
Prometheus will be our data manager. It collects data from external sources -- Telegraf in our case -- and distributes it to various destinations such as email/pager alerts, web UIs, API clients, remote storage services, etc. We'll get into those shortly.
Let's install Prometheus itself, and the Prometheus Alertmanager plugin for alerts, along with the required dependencies:
```bash
monitor:~# snap install prometheus
monitor:~# snap install prometheus-alertmanager
```
The snap will automatically configure and start the service. To verify this, run:
```bash
monitor:~# snap services
Service Startup Current Notes
lxd.activate enabled inactive -
lxd.daemon enabled inactive socket-activated
prometheus.prometheus enabled active -
prometheus-alertmanager.alertmanager enabled active -
```
Verify that Prometheus is listening on the port as we expect:
```bash
visualizer:~# ss -tulpn | grep prometheus
tcp LISTEN 0 128 *:9090 *:* users:(("prometheus",pid=618,fd=8))
```
`journalctl` can be also used to review the state of Snap services if more detail is needed. For example, to see where Prometheus is loading its config from:
```bash
monitor:~# journalctl | grep "prometheus.*config"
...
...msg="Completed loading of configuration file" filename=/var/snap/prometheus/32/prometheus.yml
```
Although the file name points to a specific Snap revision (`32`, in this case), we can use the generic config file `/var/snap/prometheus/current/prometheus.yml` here in order to make things more general. Edit this config file to register the targets we'll be reading data from. This will go under the `scrape_configs` section of the file:
```text
scrape_configs:
# The job name is added as a label `job=` to any timeseries scraped from this config.
- job_name: 'prometheus'
# metrics_path defaults to '/metrics'
# scheme defaults to 'http'.
static_configs:
- targets: ['localhost:9090']
- job_name: 'telegraf'
static_configs:
- targets: ['workload:9273']
```
Then restart Prometheus:
```bash
monitor:~# snap restart prometheus
```
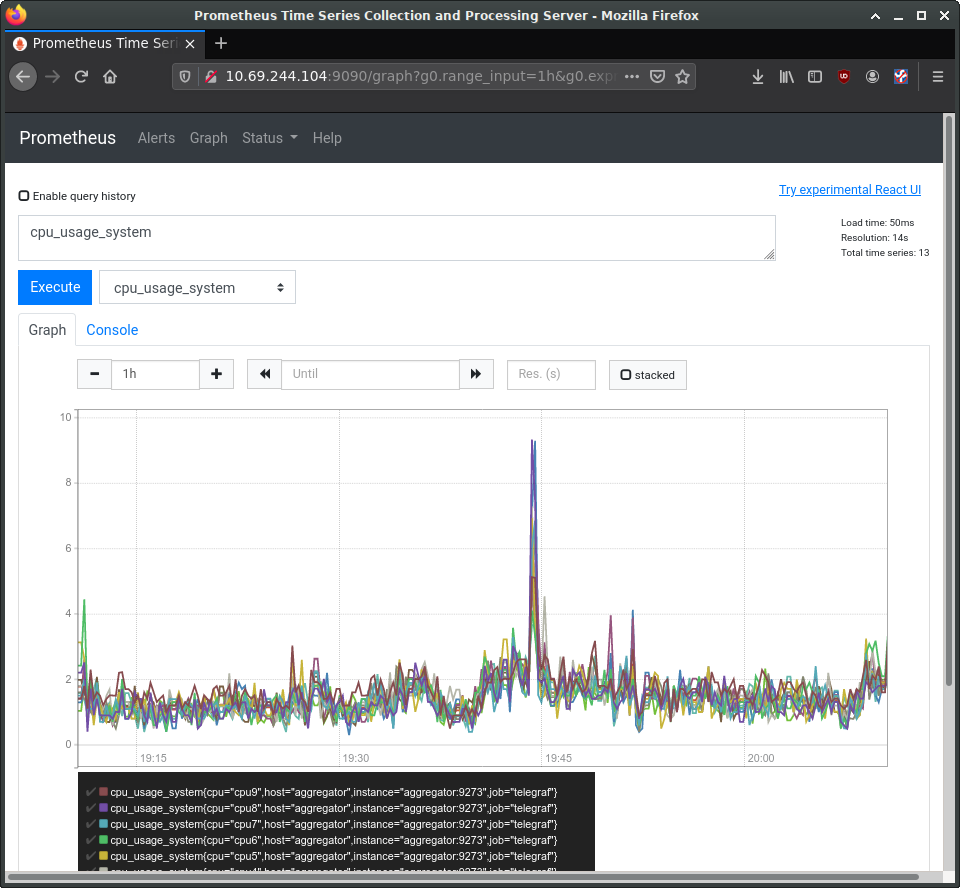
While we'll be using Grafana for visualization, Prometheus also has a web interface for viewing and interacting with the collected data. At this stage, we can load it to verify that our setup is working properly. In a web browser, navigate to the Monitor's IP address, and port `9090`. You should see Prometheus' interface, as in the following image:
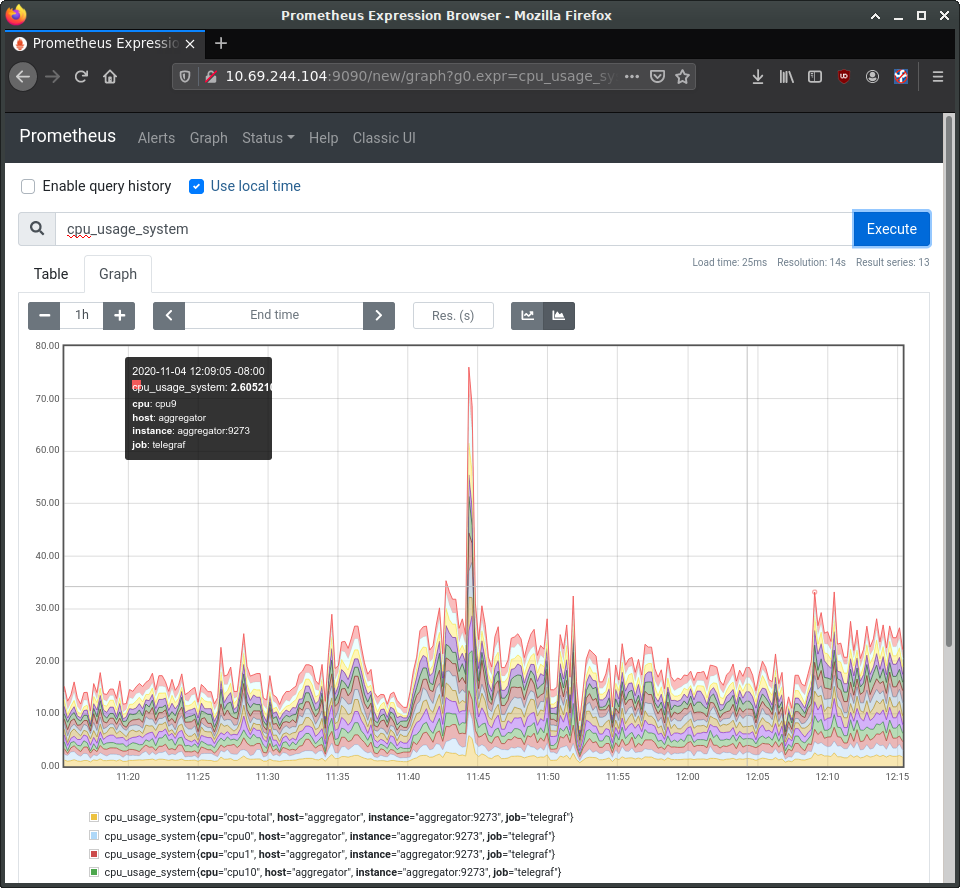
In the entry box, enter `cpu_usage_system`, select the "Graph" tab and click "Execute". This should show a graph of our collected CPU data so far. Prometheus also has a secondary web UI using `React.js`.
### Configure Alertmanager
Let's tackle the Alert Manager next. Edit `/var/snap/prometheus/current/prometheus.yml` again, adding the following to the `alerting` and `rules_files` sections:
```text
## /var/snap/prometheus/current/prometheus.yml
#...
# Alertmanager configuration
alerting:
alertmanagers:
- static_configs:
- targets:
- 127.0.0.1:9093
rule_files:
- 'alerts.yml'
```
Now create `/var/snap/prometheus/current/alerts.yml` with the following contents:
```text
## /var/snap/prometheus/current/alerts.yml
groups:
- name: demo-alerts
rules:
- alert: HighLoad
expr: node_load1 > 2.0
for: 60m
labels:
severity: normal
annotations:
description: '{{ $labels.instance }} of job {{ $labels.job }} is under high load.'
summary: Instance {{ $labels.instance }} under high load.
value: '{{ $value }}'
- alert: InstanceDown
expr: up == 0
for: 5m
labels:
severity: major
annotations:
summary: "Instance {{ $labels.instance }} down"
description: "{{ $labels.instance }} of job {{ $labels.job }} has been down for more than 5 minutes."
```
This adds two alerts: one for high processor load, and one to report if the node has been unreachable for over 5 minutes. We're considering high CPU to be a load of 2 or higher for an hour; this would need to be set to something more sensible for the style of workloads your production system experiences.
With the alerts themselves now defined, we next need to instruct Alertmanager how to handle them. There is a sample configuration installed to `/var/snap/prometheus-alertmanager/current/alertmanager.yml`, however it's full of example data. Instead, replace it entirely with this content:
```text
## /var/snap/prometheus-alertmanager/current/alertmanager.yml
global:
resolve_timeout: 5m
route:
group_by: ['alertname']
group_wait: 10s
group_interval: 10s
repeat_interval: 1h
inhibit_rules:
- source_match:
severity: 'critical'
target_match:
severity: 'warning'
equal: ['alertname', 'dev', 'instance']
```
Restart Alertmanager after making the configuration change:
```bash
workload:~# snap restart prometheus-alertmanager
```
### Install Grafana
Grafana provides our main dashboard, from which we can generate graphs and other visuals to study the collected metrics. Grafana can read its data directly from log files, but we'll focus on using Prometheus as its principle data source. Grafana is available as a Snap and can be installed like this:
```bash
monitor:~# snap install grafana
grafana 6.7.4 from Alvaro Uría (aluria) installed
```
It uses port `3000`:
```bash
# ss -tulpn | grep grafana
tcp LISTEN 0 128 *:3000 *:* users:(("grafana-server",pid=1449,fd=10))
```
We next need to know where it expects its configuration:
```bash
monitor:~# journalctl | grep "grafana.*conf"
... msg="Config loaded from" logger=settings file=/snap/grafana/36/conf/defaults.ini
... msg="Config overridden from Environment variable" logger=settings var="GF_PATHS_PROVISIONING=/var/snap/grafana/common/conf/provisioning"
... error="open /var/snap/grafana/common/conf/provisioning/datasources: no such file or directory"
...
```
We can see it is getting its defaults from `/snap/grafana/36/conf/`, but `/snap/` is a read-only directory and therefore we cannot edit the file. Instead, we should put our customisations inside `/var/snap/grafana/36/conf/grafana.ini`. You can also use the generic path `/var/snap/grafana/current/conf/grafana.ini`.
For a production installation, the `defaults.ini` has numerous parameters we'd want to customize for our site, however for the demo we'll accept all the defaults. We do need to configure our data sources, but can do this via the web interface:
```bash
$ firefox http://10.69.244.104:3000
```
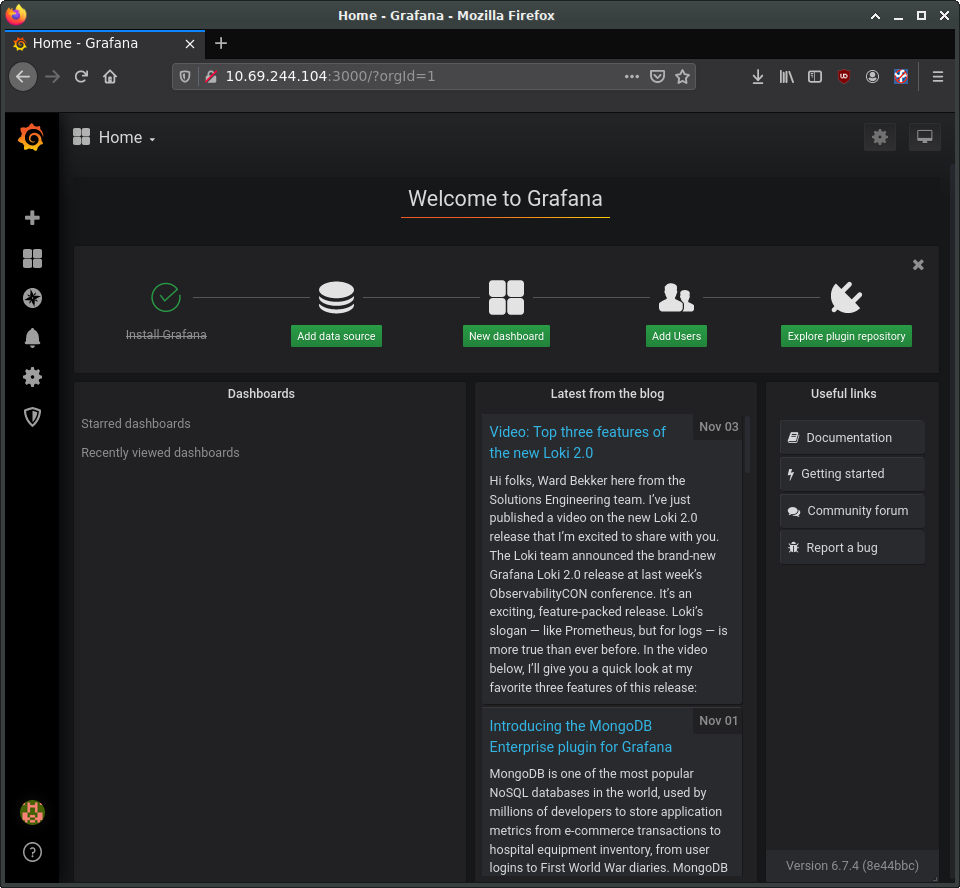
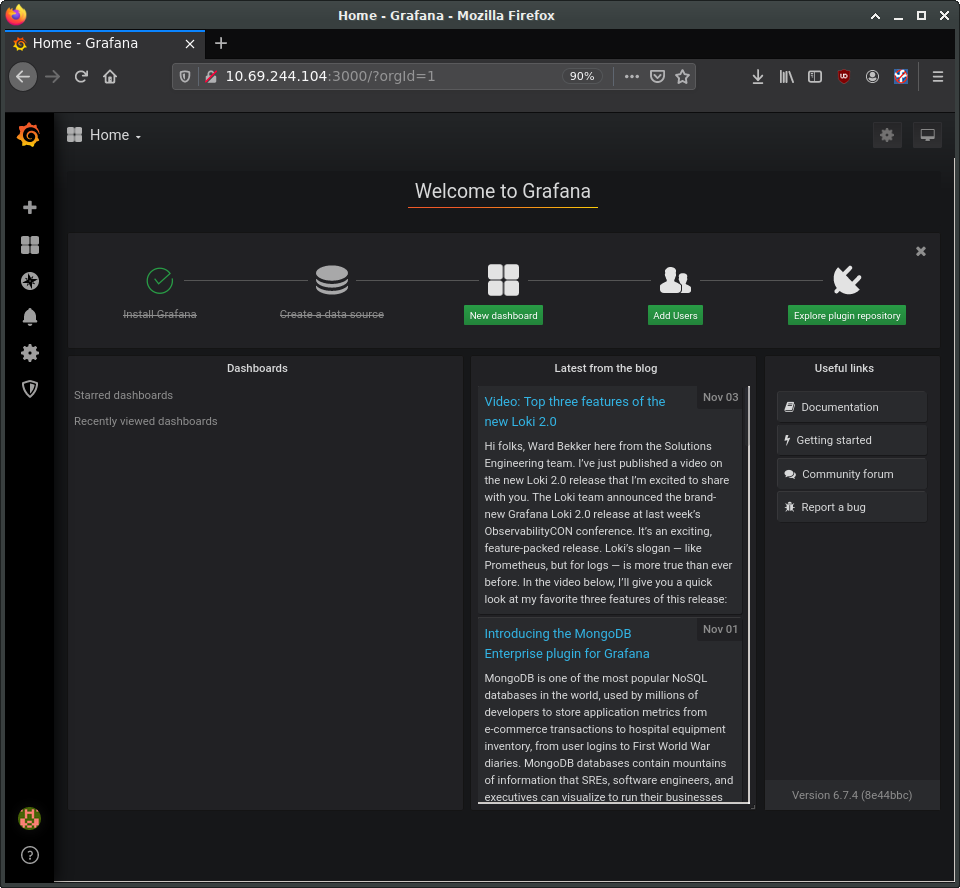
Log in with 'admin' and 'admin' as the username and password. This should bring you to the main Grafana page, where you can find links to tutorials and documentation. Delete any example data sources and/or dashboards.
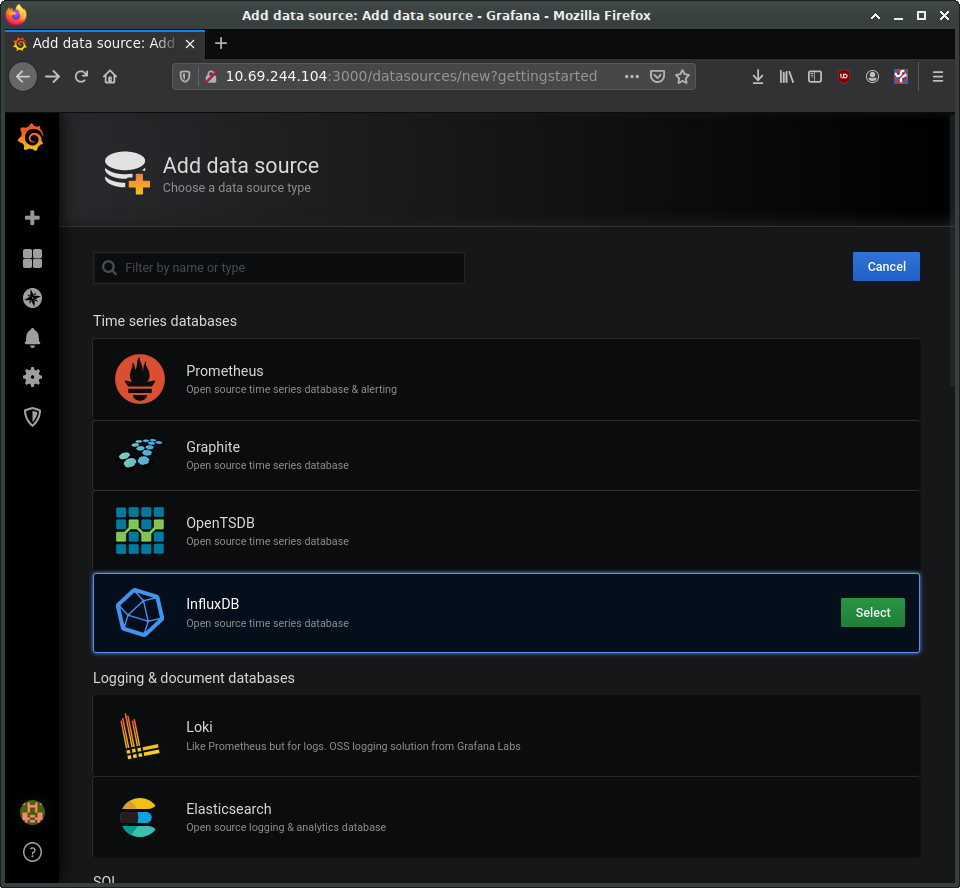
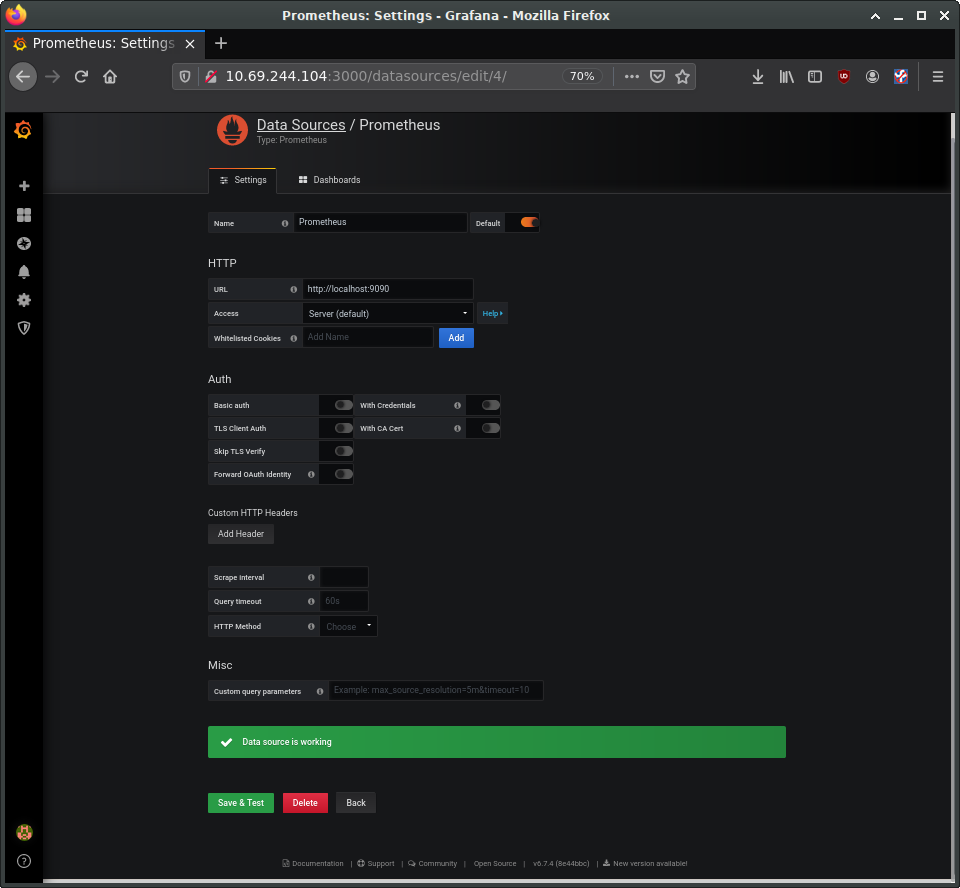
Select the button to add a new data source and select "Prometheus". On the "Data Sources / Prometheus" edit page, set:
- the name to Prometheus
- the URL to `http://localhost:9090`
- 'Access' to "Server (default)" to make Grafana pull data from the Prometheus service we set up.
The remaining settings can be left as defaults. Click "Save & Test".
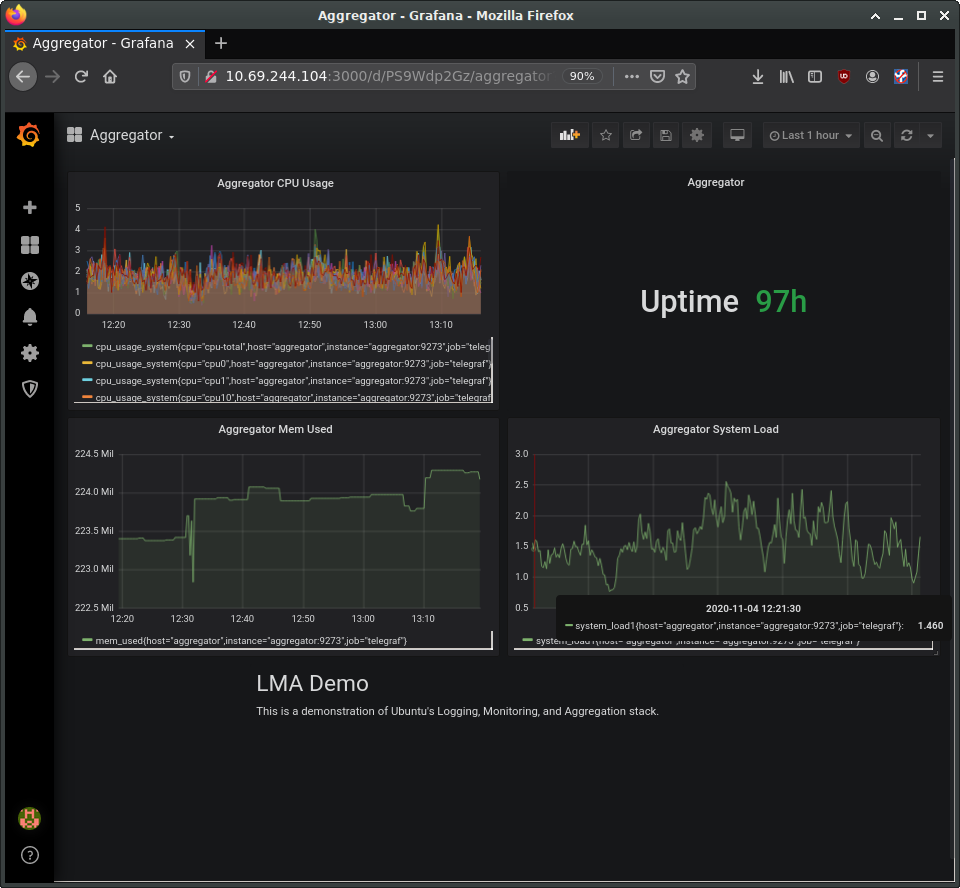
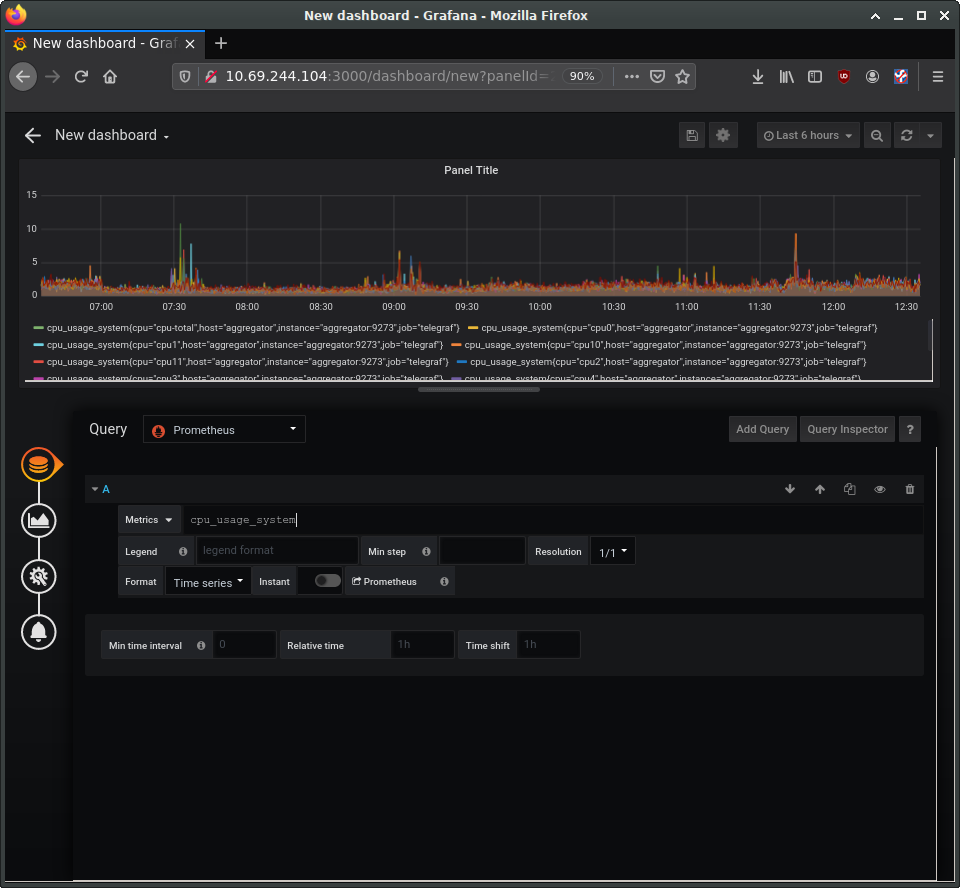
Returning to the Grafana home page, next set up a "New Dashboard". A dashboard can hold one or more panels, each of which can be connected to one or more data queries. Let's add a panel for CPU data. For the query, enter "cpu_usage_system" in the Metrics field.
 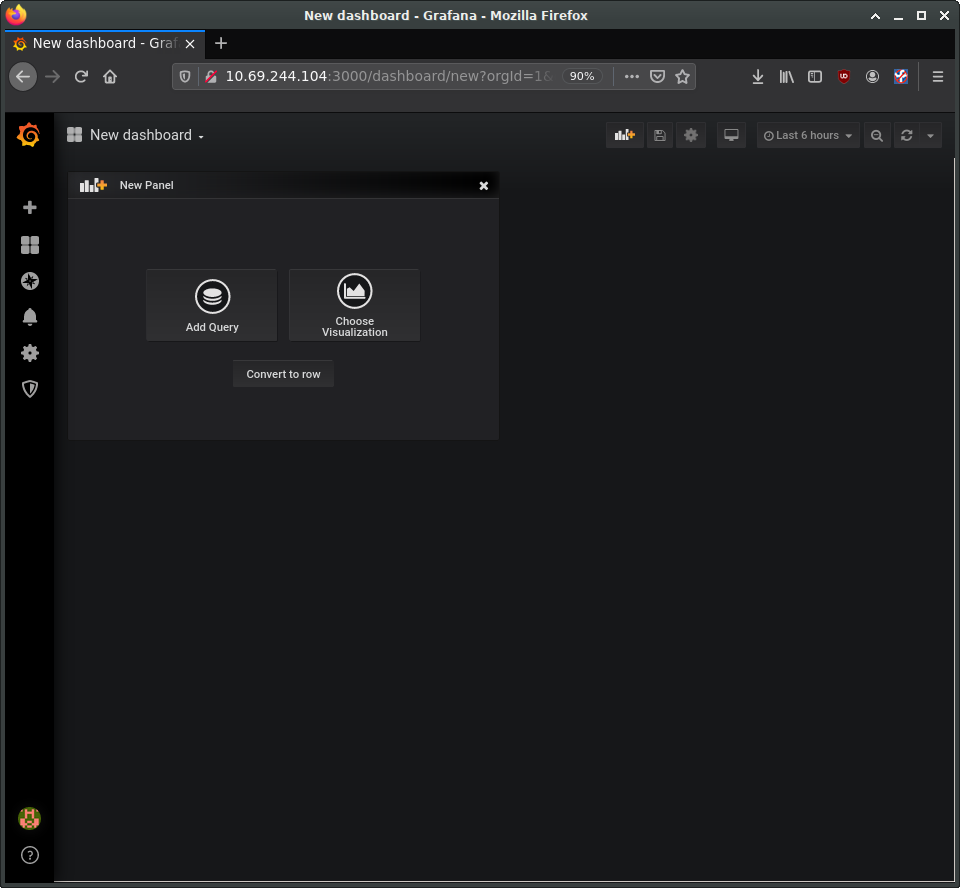 
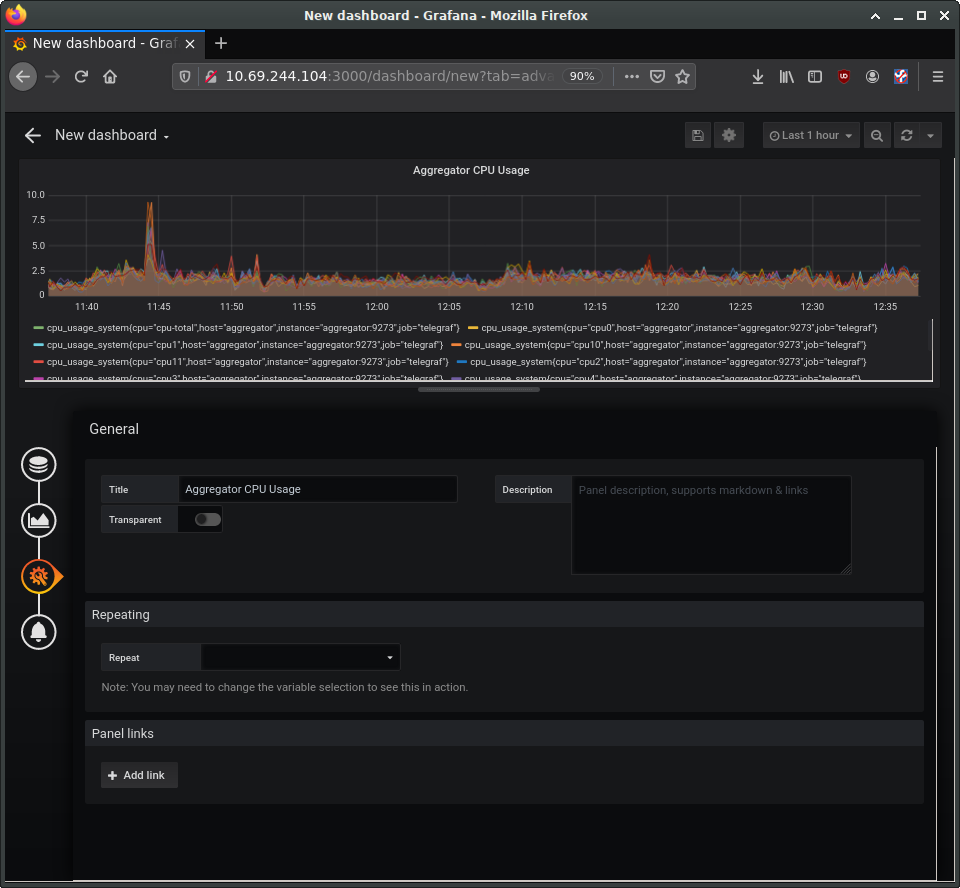
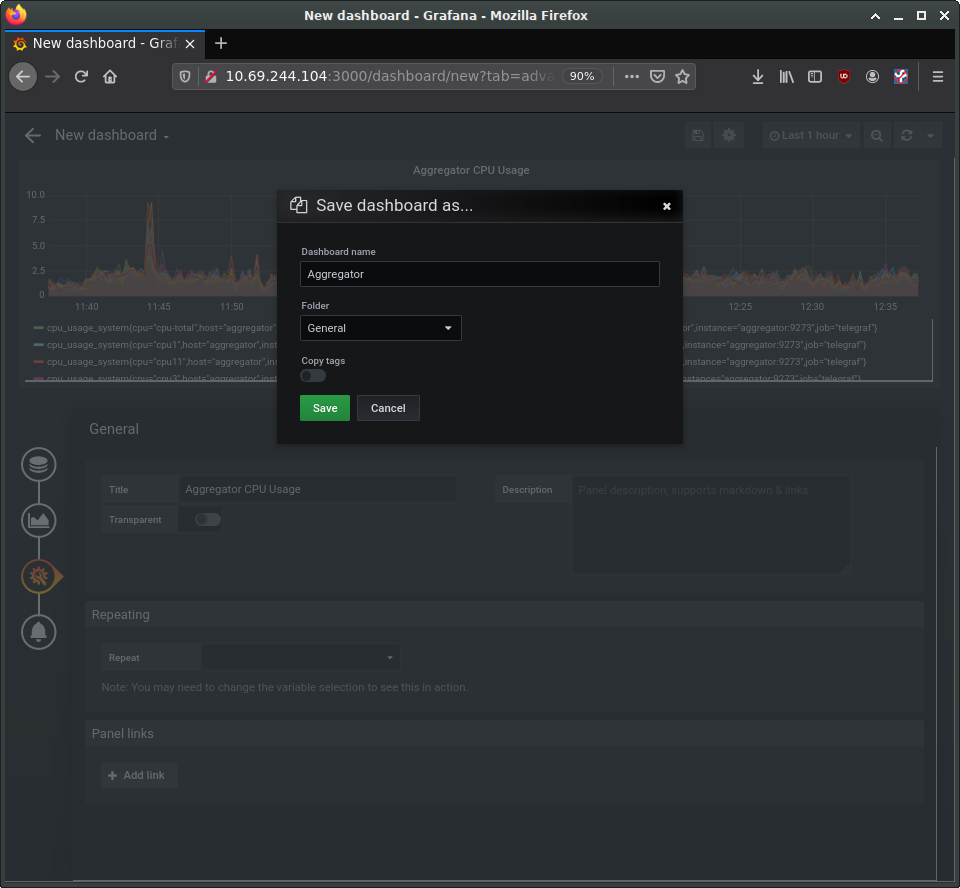
On the left you can see four buttons to configure four elements of the panel: data source, visualization, general settings, and alerts. The general settings page allows us to set a title for the panel, for instance. Make any other customizations you want, and then save the dashboard using the save icon at the top of the page.
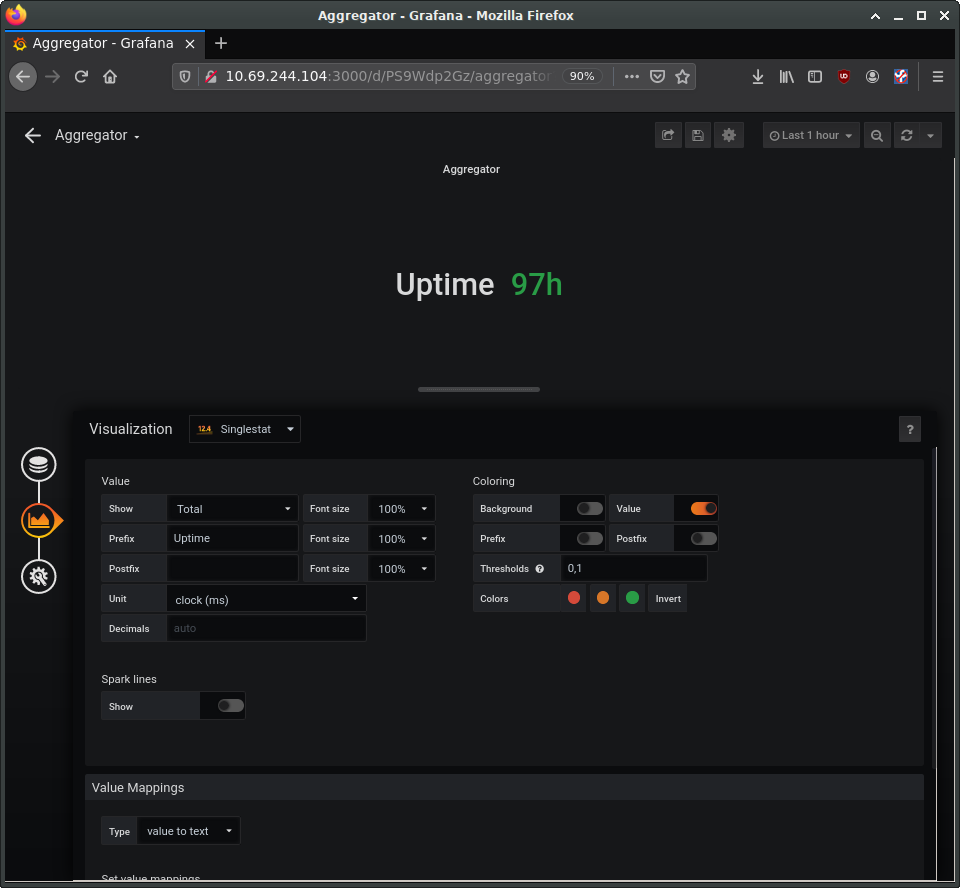
Using the same procedure, add additional panels for processor load and memory usage. Panels can be used to present other types of data as well, such as numerical indicators, logs, news feeds, or markdown-formatted documentation. For example, you can add a panel to display the system uptime, such as in the following image:
Try also adding a panel with the "Text" visualization option for entering descriptive text about our demo. Save, and then view the final dashboard: